Showing posts with label carbon dioxide. Show all posts

Wednesday, November 17, 2010

A CLOSER LOOK AT CLIMATE CHANGE (PART 8)

THE IPCC's FUZZY MATH

The Intergovernmental Panel on Climate Change (IPCC) is a group of influential scientists under the auspices of the United Nations whose main function is to peer review and approve papers written by various climate scientists from all over the world for publication. It's a selective group whose members and associated scientists have a clear mandate to toe the line, which means they must adhere to the official, "mainstream" position that the Earth is undergoing a climate crisis of Brobdingnagian magnitude - a crisis wholly caused by us dastardly, irresponsible humans. A primary function of this panel is to direct or influence policy makers around the world so they will compel their constituents - by means of rigid enforcement, if necessary - to quell their use of fossil fuels and stop "polluting" the planet. It's a disturbing example of the politicization of science to create or influence policies that can adversely affect millions.
Every few years the IPCC sponsors a summit - their last one was in December 2009 in Copenhagen, Denmark - where they try to persuade heads of state and other policy makers to pass stiffer laws against carbon dioxide "polluters". Like the ones before, nothing got done except the blowing of a lot of hot air. And that's probably a very good thing.

OK, here comes the science part. I'm going to play with some of the IPCC propaganda and use their formulas and equations to try to show how they're trying to manipulate the world's governments, media, and citizens. If the technical details don't interest you, please feel free to skip over the next few paragraphs and pick back up again when I resume my commentary, where the dark-blue typeface resumes.


At the heart of the IPCC's argument in favor of human-induced global climate change is a parameter called the climate sensitivity factor l (lambda). It's a numerical value derived from computer models dealing with radiative forcing parameters associated with a hypothetical doubling of the CO2 concentration in the atmosphere from its pre-industrial count of 280 ppmv. The IPCC's accepted value for l falls within a range of 0.8 - 1.2.  A l value of 0.8° yields a 3° C increase while a l value of 1.2 yields a more broadly accepted 4.5° C rise in global temperature with a doubling of CO2. One chart even shows a projected temperature increase guided by a l value as high as 1.7 (described below) - which would truly be catastrophic if it were only true. Meanwhile, those in the so-called skeptic camp suggest the true value of lambda (l) is well below 0.1, which works out to a temperature increase of less that 1/2° C if the atmospheric CO2 concentration doubled to 560 ppmv from its pre-industrial count of 280 ppmv. This number, l, is a value derived from purely arbitrary assumptions based on how hot it will get if the CO2 reaches 560 ppmv.  

Math is pure logic, and I've included the following paragraph to make a purely logical argument in favor of 1.) lowering the value of l to a substantially lower value than the currently accepted minimum l value of 0.8, and 2.) make an argument that even when using the IPCC's rather liberal numbers, there is alarmist propaganda out there that is ridiculously misleading.  

There is formula that is used to determine the hypothetical value of lambda (l) after which lambda (l) can be plugged into another formula to see how hot it's going to get with a rising CO2 complement of the earth's atmosphere. Here they are:


DTS = l D F 

where DTS  is the rise in global temperature, and
D F   is the increase of radiative forcing due to the increase in the CO2 concentration in the atmosphere. 
                                                                      
Here's the formula for finding the radiative forcing value D F       

DF = 5.35 X ln C/CO W m-2
[Radiative forcing is the term used to describe a sort of back pressure caused by the trapping of outgoing infrared radiation by greenhouse gasses (GHG) much as pressure inside a balloon keeps it from deflating to a flaccid state by air pressure trapped inside it.
Just as there is a slight pressure differential inside the balloon that keeps it from going limp, the radiative forcing of a GHG translates to an equal amount of extra radiation from the sun reaching the earth if the radiative back pressure were discounted.]

The efficacy of the DF formula (above) is not currently being disputed for calculating forcings for CO2 concentrations by most scientists on either side of the AGW divide, although one paper (Myrhe, et. al. 1998) asserts the relationship breaks down below 915 ppmv because it's a logarithmic function. What is being debated is the value of lambda, the climate sensitivity parameter, which is purely hypothetical.


OK, let's have some fun. Here's an alarmist chart that spells doom for the planet:

OOPS! DAMN!  This blog server is rejecting all of my attempts to post images!  I can't even upload an image of my dog!? I wonder if the global-warming storm police are trying to shut down my ability (or right) to clearly communicate my reality-based views? Probably not - maybe it's just a server glitch. But.... one never knows, does one?
So I'll make my point without the chart - you'll just have to take my word that I'm not making this stuff up. If I am able to upload charts and photos in the future, I'll replace this paragraph with the visual aids I prefer to use to get my point across.

NOTE: HERE ARE LINKS TO THE CHARTS I WAS UNABLE TO UPLOAD: 

http://wattsupwiththat.files.wordpress.com/2010/03/natural-vs-agw_warming.png
http://wattsupwiththat.files.wordpress.com/2010/03/heating_effect_vs_measured_co2.png

I have a column chart here that resembles a steep bluff arising from a flood plain. The "bluff" arising steeply towards the upper right of the chart is an alarmist perspective of what the global temperatures will do if CO2 levels keep increasing - all the way up to 560 ppm, which is twice the pre-industrial level. Superimposed on this chart is the predicted increase in temperatures based on the much more conservative model of Richard Lindzen and Yong-Sang Choi (2009). These superimposed values represent the continuation of the gradual upslope and virtual leveling off of the flood plain.


According to the data based on Lindzen-Choi model, the global temperature will warm up by 0.2° C in the event the atmospheric CO2 doubles from where it was in the 1700s, which was around 280 ppm. Plugging that 0.2° C increase into the formula, we get a value for the climate sensitivity parameter, lambda (l), a value of 0.08. This is 1/10th of the most conservative "official" values of lambda - 0.8. But there's more!
According to the chart, the temperature has already risen 2.2° C, and by the time the CO2 has doubled, the temperature will have risen 6.2° C! That's where it was back in the steamy dinosaur days! Here, the value for the climate sensitivity parameter lambda is 1.68. This would be pretty dire stuff, if it were true. But it can't be true, because the consensus is that temperatures have gone up only about 0.6° C since the Keeling CO2 measurements began 50 years ago - not 2.2° C.  I have another chart that I was going to include in this post that is based on identical data and parameters, but it has a different layout, and would have been an excellent compliment to the "bluff" chart.
OK, let's see what the value l might be if we consider the consensus rise in the Earth's temperature over the last half-century and a 34.5% increase of CO2. Here we go:

C = 390 ppm (the current count)

CO  = 315 ppm (the count at 1957 per Keeling)

Using the formula for CO2 forcing we get 5.35 X ln (390/315)=1.143 Wm-2

That's our value for DF

Now, to find lambda (l) using the first formula
DF, the increase in radiative forcing, is
1.143 Wm-2

DTS , the temperature change is about 0.6° C
according to data compiled by Dr. Phil Jones of the CRU in East Anglia UK. Plugging 0.6° C into the formula to find l yields:

l = DTS / DF = 0.6° C / 1.143 = 0.525
 

Now, when the atmospheric CO2 concentration doubles, we get a radiative forcing  
DF of 3.71 Wm-2

How do we know that? Plugging the numbers into the formula  we get:
C / CO = 560/280 = 2. The natural logarithm (ln) of 2 is 0.693 so 0.693 X 5.35 = 3.71 Wm-2


That’s our radiative forcing value DF
Now, when you plug in our derived values for l


DTS = lDF = DTS = 0.525 X 3.71 = 1.95° C


OK, we're done with the math - you can start reading again. So, if the carbon dioxide concentration in the atmosphere were to keep rising to 560 ppm from the 390 ppm we have now, we'd (allegedly) see a temperature rise of 1.95°C - not 3° or 4.5° or even 6° C as the IPCC claims.
Now, what are we to make of this? This result is far smaller than what the IPCC is threatening will happen. Yet it's far larger than the 0.15° to 0.2° C rise postulated by Lindzen and Choi based on the quantum mechanical behavior of CO2.


There are still plenty of questions. One, the formulas are the IPCC's formulas, and they were derived from computer models that are at best questionable and often don't agree with one another. And two, (very important here) these equations assume that the 0.6° C rise in the earth's temperature during the 53 years of David Keeling's measuring of atmospheric CO2 is due to the CO2 and not the sun, which appears to be increasingly active, on average, over the last 100 plus years. If the sun is what's warming the earth, and not CO2, then the Lindzen-Choi climate sensitivity parameter (l= .04) may be closer to the mark. 
With this presentation (above) I've tried to show directly by means of alarmist charts the type of fear propaganda the IPCC and its minions are trying to bamboozle us with. If you looked at these charts and didn't know any better you would be afraid. Very afraid. That's part of the problem - some of the people who don't know any better - they wouldn't know science if it punched them in the face - they buy into this stuff hook, line, and sinker. They believe everything they hear and devote their attention to the most dire, most dramatic scenarios we're told may happen or will happen, depending on the source. The people I'm referring to are the policy makers - the politicians who are angling to write laws that will make us stop "polluting" the air with CO2. Such monstrosities as Cap'n'Trade, utility taxes over and above the taxes we already pay on utilities, and other maneuvers that are supposed to make us conserve. Don't get me wrong, I'm all for not wasting energy, whether it's gasoline or electricity. But the politicians - people like Reps. Henry Waxman and Edward Markey, who co-authored the cap'n'trade bill in the house that the Senate wisely killed - are vying to run up the costs of utilities to "encourage" conservation and "encourage" people to get rid of their old appliances and cars and buy new (and expensive) energy efficient appliances and cars. The well-to-do can certainly afford to buy this expensive new stuff and feel good about themselves for doing so. They can afford to upgrade their homes (and mansions) to make them more energy efficient as well, but what about the less fortunate? What about the people who would like to save on their utility bills but are stuck with their old, energy-inefficient beaters and leaky refrigerators and vintage electric stoves and microwaves, and live in drafty, ramshackle apartments without insulation? 
Last year we had a "Cash for Clunkers" program that benefited the well-to-do but hurt the less fortunate who couldn't afford to buy sleek new cars (See my post of 8/9/2009 - Cash for Clunkers - a bad idea).  Moreover, low-income people had trouble finding used cars at a price affordable to them because the CforC program depleted the used car market and made used cars more expensive. President Obama, whom I support on many issues, is allowing the IPCC to lead him by the nose. He is a prime example of a prominent world leader (one of many) who's been snared by the alarmist dogma of the IPCC and its associated apocalypse-mongers. There's a real danger here. IPCC-affiliated scientists, with a lot of help from the media (who think the global warming issue makes good copy), are propagating a dangerous and potentially devastating agenda for no good reason other than to make a lot of money for themselves. The IPCC, part of the UN, is a political organization with policy objectives that suit their own ends. They get billions in funding approved by sympathetic but ignorant government bureaucrats worldwide and are, by extension, depriving funds for scientists who practice climate science as a dispassionate search for the Truth. Not only that, they are impeding the publication of research papers by scientists who don't agree with their views on this issue. Further, they're influencing government bureaucracies to implement harmful policies that will, or are, being hurtful to ordinary people. A case in point: The Environmental Protection Agency (EPA) has recently declared CO2 a pollutant, for crying out loud! I guess that means every human being on Earth is spewing pollution out of their mouths with every breath - about 1.6 billion metric tonnes worth per year. And that's just the people! Factor in the animal and plant life in the entire biosphere and you have a staggering amount of "pollution" being emitted. It makes no sense to arbitrarily call it pollution.
With the EPA now invoking CO2 as a pollutant we can look forward to even higher electric bills, which are already high, because of heavy taxation, brutally cold winters and stifling hot summers and existing restrictions.

As someone with a rich background in science, I can see what's going on through the weeds of propagandistic proclamations and dogmatic boilerplate by a cadre of people who must think I'm stupid, and must think everybody else is stupid as well. In many cases they're right about that. Unfortunately many politicians, bureaucrats, and media types are missing the boat, but fortunately..., an increasing number of people are waking up to what's going on, and they're not buying it any more. At some point this alarmist movement will finally become discredited and piddle out, like the infamous "hockey stick" chart by Mann, et.al. (see CLCC - 5  Quack Science - posted on 11/14/2010). We can only hope this movement's demise doesn't come too late.  With my next post (CLCC - 9) I'll discuss one notable (and noble) scientist who thinks it's all a lot of malarkey, and what the apocalyptics are saying about him. Stay tuned.

Tuesday, November 16, 2010

A CLOSER LOOK AT CLIMATE CHANGE (PART 7)

HOW MUCH CARBON DIOXIDE IS TOO MUCH?


Here's a little thought experiment (I borrowed the term from Albert Einstein). Imagine you're at a huge stadium watching a football game. Take Michigan Stadium, for example. I've been there. The place holds a lot of people with a lot of air in their lungs. A lot of people - as in 110,000 people. To get a perspective, here's what the place looks like from 3,000 feet:

OK, imagine you're at the game - the place is packed with one-ninth of a million screaming fans, of which 23,100 of them are rooting for the other team - let's assume the other team is Washington State University (WSU) - they were the visiting team when I took this photo from my Cessna. That leaves most of the remaining 86,900 odd fans rooting for Michigan. The 23,100 WSU fans represent the 21% oxygen component of the atmosphere, with most of the rest representing the 78% nitrogen component. But then there are some oddballs. There are about 3,100 fans who cheer the Michigan cheerleaders - they represent the water vapor component (it's a humid day), and 1,100 fans (the argon component) cheering for the WSU's cheerleaders . But there is one element that has the play-by-play announcers' (the media's) attention, and that's the 43 Hell's Angels who've distributed themselves randomly throughout the crowd. They're just there to make noise.
So... that's our fan base in a nutshell.

OK, here we go.
Michigan scores a touchdown! The 86,900 fans cheer loudly. Hear 'em? They're loud as hell. WSU scores, and their 23,900 fans let out a prolonged whoop. Although it's not as impressive as the roar from the 86,900 Michigan fans, they hold their own as noise makers. Now, there's a time out, and the Michigan cheerleaders are prancing and dancing - you hear a smattering of cheers from their 3,100 fans. The WSU cheerleaders have their turn and their 1,100 fans loudly voice their approval. OK, you're in this big, cavernous stadium, and eleven hundred people can still make enough noise to get noticed by any blind people (the refs) that happen to be in the stadium. But what about the bikers? There's forty-three of them. How much noise do you think they can make in comparison to the 86,900 Michigan fans, or even the 1,100 WSU cheerleaders' fans screaming at the top of their lungs? OK, you get the picture? The upshot of this parable is: out of every 110,000 molecules of air, only 43 of them are carbon dioxide molecules.

Carbon dioxide currently makes up 0.039% of the atmosphere. That's thirty-nine thousandths of one percent. It's a greenhouse gas, to be sure, but as a greenhouse gas it's only about 20% as potent as water vapor. So, on a humid day, when when the air contains about 2.8% H2O, the humidity constitutes 99.7% of the greenhouse effect.

What everybody's worried about is that 1/4 to 1/3 of one percent  (0.3 %) of greenhouse effect driven by carbon dioxide is heating up the planet enough that there will be more humidity and thus more greenhousing by water vapor which will warm the planet up even more and make more water vapor and heat the planet up even more... - it's called a runaway greenhouse effect. There's another concern that that 0.28% greenhouse effect by carbon dioxide will turn into 0.56% and then 1.12% and that will lead to more humidity that will in turn lead to more warming and so on and so on and so on.....! It could happen! (But probably won't). Nobody really knows for sure. But what irritates me is that the apocalyptics are playing Chicken Little - they're pushin' too hard on me and a lot of other people to warrant any credibility. It's like, whoever makes the most noise gets the attention, you know, the squeaky wheel, but it's not good attention.

Richard Lindzen is an atmospheric physicist at the Massachusetts Institute of Technology (MIT) and is widely considered at the top of the heap of atmospheric scientists. In 2009 Dr. Lindzen co-published a paper with Yong-Sang Choi, a young graduate assistant, in the journal Geophysical Research Letters known as LC 2009. In this paper Lindzen and Choi argued for a much smaller climate sensitivity parameter, called lambda (l), than the "official" IPCC-sanctioned value based on an increase of temperature falling within a range 3° C to 4.5° C if the atmospheric CO2 concentration were doubled. According to the IPCC, the value of  l then, is between 0.8 and 1.2. The LC2009 paper suggested the real value for l was 0.04, which translates to a rise of global temperature of only 0.15° C with the doubling of CO2. That's only 1/20th to 1/30th of the "official" IPCC line for the doubling of CO2. As expected, their paper elicited a howl of protest from the apocalyptics. Almost immediately an army of global warming proponents rushed to publish rebuttals and try to discredit LC2009.

As physicists, Lindzen and Choi employed quantum mechanical principles as a foundation of their work - they predicated their study on the quantum mechanical behavior of the CO2 molecule when it gets hit by quanta of long wave (infrared) radiation trying to escape into space. Below is a chart based on their work.
Below is another similar chart that's quite instructive.
They look like left handed (reverse) hockey sticks, don't they?

According to these graphs, we are not heading towards a global catastrophe. Again, these charts are derived from the physical traits of the CO2 molecule (which is better depicted as OCO, or better yet, O=C=O) insofar as it's ability to trap long wave radiation in the earth's atmosphere. This is because when a CO2 molecule gets hit by a quantum of longwave radiation, wiggles and wags for a micro-second or two before emitting the quantum (or photon, if you will) at a slightly lower energy level and returning to its ground state. Its linear structure and stable double covalent bonds limit the number of frequencies that can affect it to only 3 relatively narrow bands (2.7, 4.5, & 15 microns). There's a formula with which the modes of vibration, or "degrees of freedom" of a given molecule can be affected by longwave radiation. That formula is simple: 3n-5, where n is the number of atoms in a given molecule. With CO2, there are three atoms, two oxygen and one carbon, so one could assume that 3 X 3 - 5 equals four degrees of freedom. One of those degrees of freedom are invalid with CO2, so the CO2 molecule has only three degrees of freedom to vibrate (absorb longwave radiation). That's why as far as greenhouse gasses are concerned, it's one of the weaker ones.
Another factor to consider is that as the concentration of CO2 increases, the absorbtion bandwidths DO NOT increase, only the amplitude increases (up to a point - ca. 915 ppmv). What this means is that outgoing longwave radiation is absorbed closer to the surface of the earth. Rather than being almost completely absorbed say, within the first kilometer of the lower atmosphere, the lion's share of outgoing radiation gets absorbed within say, a half-kilometer of the earth's surface. While it may yield slightly higher night-time temps within the lowest levels of the atmosphere, this effect is NOT cumilative. As soon as the sun comes up and visible radiation heats the surface of the earth, the slight increase in temperature in the lower atmosphere from overnight gets completely overwhelmed. Another thing to consider is that outgoing longwave radiation occurs only at night. Again, after the sun comes up, all the longwave radiation gets obliterated by the sunshine that is now heating the earth directly.  

As stated above, once the concentration hits about 915 ppmv, OCO completely runs out of steam (Myrhe et. al. 1998). It's called saturation, or activity extinction, where additional CO2 concentrations have little to no effect. Think of a large bell. Tap it with a hammer and it will ring. Hit the bell a little harder and it will ring a little louder and keep ringing longer. Hit it harder yet and it will ring even louder and longer. But there comes a point when no matter how hard the bell is struck, it won't ring louder or longer beyond that point. The bell has reached a saturation point.  

Are Lindzen, Myrhe, and other scientists correct? I guess time will tell. All scientists who study complex systems like climate can do is offer their opinions and educated guesses. That goes for both sides of the AGW issue. We run into problems when scientists, who are, after all, foibled human beings, interject their personal opinions and beliefs into what is supposed to be a dispassionate pursuit of the Truth. And where we run into BIG problems is when politics gets involved that directs scientists to misuse science in pursuing political mandates rather than pursuing and/or finding real answers to difficult questions.

Monday, November 15, 2010

A CLOSER LOOK AT CLIMATE CHANGE (PART 6)

IS CO2 CAUSING CLIMATE CHANGE? OR IS CLIMATE CHANGE CAUSING CO2?

Revised 8/6/2011

Back in the 1950s when Roger Revelle was pondering the relationship between atmospheric CO2 and the oceans (CLCC - 1), he concluded that the oceans weren't an unlimited sink that would go on dissolving CO2 forever and keep atmospheric concentrations from getting out of hand. The so-called "Revelle Factor" is a measure of the resistance of the ocean's surface to dissolve CO2 because CO2, the gas, has to dissociate into bicarbonate ions (HCO3-).  and carbonate ions (CO3= ) at the water's surface in order to enter into solution. Thus, there's a chemical equilibrium established between the HCO3- and the CO3=  ions at the

sea surface and the molecular CO2 in the air. The equilibrium of the current system is such that for every ten additional ppmv of CO2 in the air, only one ppmv of CO2 dissociates at the ocean's surface and goes into solution.   Now, the argument that proponents of Anthropogenic Global Warning (AGW) are trying to make is that CO2 is entering the atmosphere because of "human activity", which is true, but human activity may not be the whole story. Here's the argument some scientists are making: - Global warming is causing more CO2 in the atmosphere.  
As any high school chemistry class teaches, many chemical reactions are reversible. Anything that disrupts the equilibrium of a chemical system will drive the reaction either forward or in reverse until equilibrium is regained. So we have a system in which the dissolved carbonate and (predominately) bicarbonate ions in the sea are in equilibrium with the CO2 molecules in the air. If the oceans are heating up, which we're told they are, the equilibrium will be shifted towards dissolved CO2 (in its ionic forms) reconstituting into airborne CO2 molecules at the ocean's surface and entering the atmosphere. It's a two-step process that looks like this:

Warmer <--------------------------
(carbon dioxide molecule) CO2   +   H2O  ⇌  H3O+ + HCO3-  (bicarbonate ion)
                     

 (bicarbonate ion)   HCO3-  +  H2O ⇌ H3O+ + CO3=  (carbonate ion)
------------------------------> Cooler

So, in a nutshell, the CO2 in the atmosphere is in equilibrium with bicarbonate and carbonate in the ocean. A warm ocean tends to drive the whole reaction to the left to produce carbon dioxide from its water solution (a process known as outgassing). Cold water will cause the equilibrium to shift to the right, causing more carbon dioxide to enter into solution in the ocean.
It's easy to visualize this when you consider that 98% of the total CO2 on the planet's surface is dissolved in the oceans as carbon dioxide, bicarbonate, and carbonate. Only 2% is in the air, so it doesn't take a really big equilibrium swing to push some of that dissolved 98% CO2 abundance out into the air.


So how could the oceans be heating up by themselves - without any help from the man-made greenhouse effect? It would have to be the sun, according to many astrophysicists, one of which is Dr. Willie Soon of the Harvard-Smithsonian Center for Astrophysics, whom I referenced in my previous post. Let's have another look at the Hubert Lamb chart (the bottom one):
Let's compare that with a record of observed sunspots encompassing the same time period:
This chart tracks sunspot activity over the course of the last millennium. It's kind of a funny chart - it's read from right to left, with the recent past expressed on the left side of the chart. In other words, it's a backwards chart.
Now if you could flip this chart around and compare it to the climatic data from Hubert Lamb, you'd see a striking resemblance. Here's another sunspot chart that can be read the normal way - from left to right:
                              
This is a zoomed-in version - it only shows the last 400 years beginning with the Maunder Minimum - which coincides with the Little Ice Age. From about 1665 to about 1700 there were only about 1/800th as many sunspots as usual. Relatively speaking, the sun was taking a long nap.                 

According to astrophysicists, more sunspot activity means a more active, hotter sun. The connection between sunspots and the climate was cited by astronomer John A. Eddy in a paper he published in 1976. Historical records of sunspot observations were meticulously consolidated in the late nineteenth century by Gustav Spörer and Edward Maunder that included post-Galileo telescopic observations and pre-Galileo naked-eye observations of the sun when it was low in the sky. Eddy supplemented the Spörer - Maunder data with proxy data obtained from carbon-14  (14C)   levels found in tree rings. There's an inverse relationship between solar activity and the presence of  14C that is, when 14C levels in tree rings were low, solar activity was high, and vise versa. Tree rings, by the way, are also a means in determining temperatures in the past, they can establish a direct link between temperatures and solar activity.  

Many stars show a variation of luminosity over time - they pulsate because of back-and-forth equilibrium shifts in their cores. The sun isn't a particularly large star - it's known as a "yellow dwarf", although it radiates strongest in the yellow/green frequency range (flash a glance up at the sun or at a reflection of the sun in a windshield and you'll see a pale green disc). Being a smaller star, the sun is more stable than the bigger ones, and its luminosity pulsations are much smaller in magnitude than massive stars. Moreover, the time scales of these variations are measured in decades and centuries rather than every few days as with the bigger stars. The Lamb chart, in fact, appears to show a roughly millennial cycle, with temperatures once again on the upswing after being cooler for more or less five hundred years since the end of the Medieval Warm Period, which itself began over a thousand years ago. These are general trends - on shorter timescales there appear to be hiccups of cooler or warmer trends within the longer millennial trends. In fact, since about 2000 we appear to be experiencing a leveling off or even cooler burp which coincides nicely with diminished sunspot activity since about 2000 (Revision: The decade 2001-2010 has turned out to be one of the warmest periods in decades. Some experts are predicting the current decade 2011-2020 will be cooler. They cite the PDO (Pacific Decadal Oscillation) and the AMDO (Atlantic Multi-Decadal Oscillation) compounding each other to influence global temperatures, that is, they reinforce each other at times and cancel each other at other times, that is, they establish a resonance which repeats roughly every thirty years. Thus, the period of 1980-2010 was warmer than the long-term average[similar to the warm period of 1915-1945, which peaked in intensity during the Dust Bowl years]. Moreover, the La Nina - El Nino phenomena plays a major role as well. The second or third strongest La Nina of the past 100 years is blamed for the extreme temperatures and drought conditions in much of the Continental US this summer. At the same time, the Pacific Coast has experienced much cooler than average temperatures.) 
On a mucher longer scale, proxy evidence holds that there have been warmer periods interspersed with cooler periods over several thousand years. There was a substantial warm-up during Roman times, and another one during the Minoan Civilization between the 15th and 20th centuries B.C., each warm period being followed by a cool one.

Many paleoclimatologists believe that, historically, CO2 concentrations follow the earth’s temperature up and down over time instead of the other way around. In other words, when the sun is more active and heats up the Earth, more CO2 enters the atmosphere, and when the sun takes a nap the Earth cools and CO2 dissolves back into the oceans and seas.


The paleologic record, however, is inconclusive on any hypothetical link between global temperature and CO2 concentrations - there are a lot of complex variables that determine climate over vast timescales, so the warming-leads-to-CO2 theorists will have to rely on sunspot records and historical anecdotal evidence going back centuries, or at the most, millennia, to argue their case. Nevertheless, here are some paleologic charts to illustrate how difficult it is to make a convincing argument one way or another. Note: these charts are laid out temporally from right to left - they're backwards.

ABOVE - a temperature chart covering the last 550 million years

ABOVE - a temperature chart of the last 600 million years – pretty much the same as the one above it. Note that today's temperature is the lowest global temperature in more than 600 million years. 

ABOVE: A chart of the CO2 concentration in the atmosphere during the last 600 million years

ABOVE - a composite chart of CO2 and temperatures over the last 600 million years. The temperature is the blue line, the CO2 is the orange one. Sometimes the temperature follows the CO2 down, sometimes it follows CO2 up, yet other times the temperature takes the lead and CO2 follows. And in several instances the temperature is skyrocketing when the CO2 is in virtual freefall. Of particular note: The earth was hottest at the beginning of the Mesozoic Era (about 251 Mya), a sizzling 22° C, at a time when the CO2 was at its lowest concentration of the distant past.
Finally, here's the chart I put up in Part 4 (CLCC - 4) - the one where the temperature readings are exaggerated. This is a very crude chart - with data points every fifty million years. The data points represent the average values of each parameter for each of the 12 periods from the Pre-Cambrian to the present epoch.
There is a vague resemblance to the more precise graphs above, especially the CO2.       Stay tuned.

Saturday, November 13, 2010

A CLOSER LOOK AT CLIMATE CHANGE (PART 4)

SCIENTIFIC CHARTS: WHAT DO THEY REALLY TELL US?


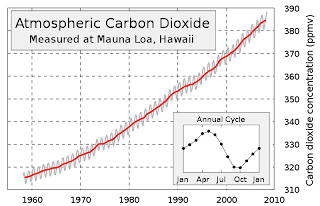
In Part 1 of this series (CLCC - 1), I included a chart of the Keeling Curve that clearly shows how the CO2 levels in the atmosphere are rapidly increasing. Here it is again.

Now understand, this chart is accurate. The CO2 concentration in parts per million (ppm - often expresed as parts per molar volume, ppmv, which means the same thing) is clearly labeled along the right side of the chart. The years are shown along the bottom in increments of ten years. The chart is subdivided by grey dotted lines, called grid lines, to better pinpoint where on the chart's body the data points are located. For example, to find out what the CO2 level was in 1970, you simply trace up the grid line labeled 1970 to the point where it intersects the red line, which is about halfway between the two horizontal grid lines labeled 320 and 330. This tells you that in 1970 the CO2 concentration in the atmosphere was about 325 ppmv. Likewise, if you want to know, for example, when the CO2 concentration reached 360 ppmv, you follow the grid line left from where it's labeled "360" and you find it intersects the red line about halfway between the two grid lines labeled "1990" and "2000". This tells you that the CO2 count hit 360 ppmv in about 1995. Simple enough.


This chart is the most widely used chart by the anthropogenic global warming proponents to scare the bejesus out of you. But when you look at the range, where the numbers start and where they end, you'll notice that the lowest values (the baseline)represented are 310 ppmv and the year 1960, which was soon after data collection by Dave Keeling began. However, there are other ways of looking at this same data that are just as accurate but give a slightly less drastic picture of what's happening. Here's a chart that covers the same time period - 1960 to the present - but the ppm range starts at zero ppm, not 310 ppmv. Check this out:


This chart shows the same curve, made up of the same data, but it depicts the same information from a "big picture" or a "zoomed out" perspective. We can see the CO2 concentration in the atmosphere is definitely increasing, and the slight upward curvature indicates an accelerating accumulation of CO2. It's really just like the Keeling chart, only not as dramatic in appearance.

The reason this chart looks different is because the CO2 concentration is expressed as the total concentration of CO2 in the atmosphere, not just the concentration of CO2 compared to where it was in 1950 and using that concentration as the “floor” of the chart rather than the true floor of zero.


Looking at the second chart, you can see that the data range
covers only a little under two of the nine horizontal intervals. That translates to an increase of about 24% since Keeling started keeping meticulous records of CO2 levels more than fifty years ago. But when you look at the Keeling chart, it looks like the concentration of CO2 has gone up nearly 100%, not 24%. Nevertheless, in the grand scheme of things, the CO2 concentration of 390 ppmv has increased 39% since the beginning of the industrial era.


In defense of the Keeling chart, it does represent a zoomed-in view of the trend which allows one to more precisely locate CO2 concentrations at specific times in history.


Now, in the grand scheme of things, exactly how does a CO2 count of 390 ppmv stack up against where it was during other periods in Earth's history? Here's a chart showing CO2 and oxygen (O2) concentrations in the atmosphere, along with the Earth's temperature during the last 600 million years.

The numbers on the left represent multiples of today’s concentrations while the numbers along the bottom represent intervals of 50 million years. The legend on the right color-codes the data and stipulates the method in which the data is expressed.


As the legend shows, the olive CO2 line and the red oxygen (O2) line express values as ratios, or multiples of the concentrations of these gasses compared to today’s values, which are expressed as the straight blue line along the bottom. So you can see that 500 million years ago the CO2 concentration was sixteen times higher than it is today. Similarly, atmospheric oxygen was only at about 8% 500 million years ago, or 40% of the oxygen component of our atmosphere as it stands today, which is 21%. But the purple temperature line is different. It does not say that the earth was seven times hotter 500 million years ago – it says it was seven degrees warmer, or about 21° C. This chart greatly magnifies the temperature trends over time. Now, the advantage of this format is that temperature trends can easily be seen to follow the CO2 trends. Temps are high when CO2 is high – when CO2 concentrations drop, temperatures drop with it. If you want to clearly express these trends, this is the type of chart you want to use.

But what if we express temperature over time in ratio form with respect to the current temperature of 14° C? If we did that, it would look like this:


Now we have a whole different picture. With the notable exception of CO2, which is still up in the stratosphere, all the other parameters are hugging the blue line - including the purple temperature line. The expression of temperature as a ratio brings it in line with the other parameters - the temp never gets above one and a half magnitudes of the current temperature. So if I wanted to lead someone to believe that carbon dioxide has minimal effect on temperature, I'd show them this chart.

The data itself may not be lying, but the presenter can, and often does, distort what the data actually says. This is especially true when politicians want to manipulate their audience so they can get a political advantage or when scientists want to manipulate a lay audience to believe they have established some kind of profound truth. Even when the data doesn’t lie, one can sway people’s opinions on a massive scale. It gets worse when politicians and scientists use false data (the infamous “Hockey Stick” comes to mind) to get people to believe a lie. The point of all this is this: The manner in which data is presented has an effect on how the observer interprets it. Please see my next installment (CLCC - 5) where I discuss  the "Hockey Stick" and how this false chart came to be.

Friday, November 12, 2010

A CLOSER LOOK AT CLIMATE CHANGE (PART 3)

SOME CONTRARIAN VIEWS

Here’s my personal belief – Dr. Hansen means well. In his own mind, he’s convinced he’s right about catastrophic climate change, and he may very well be right on some points of the debate. Hansen has some luminaries in his corner, to be sure. That great, internationally renowned scientist Osama bin Laden has taken up the cause – pontificating from his hideout in Pakistan about the evil West’s involvement in the destruction of Muslim lands with its wanton disregard for the global environment. He was talking about the Pakistani floods earlier this year. Why did the floods happen? According to Osama, global warming caused by the Infidel West was a direct causation of the flooding that killed more than 1,500 Muslims, upended the lives of over 30 million more, and ruined 20% of Pakistan’s countryside.
There was another flood several millennia ago, according to the Bible. That flood was supposedly caused by God to destroy the people who were sinning profligately and were living in the area that sustained the flood. The big difference: That flood was caused by God to punish the sinners and infidels who lived where the flood happened, whereas the recent floods in Pakistan resulting in such devastation to the Muslims who were living there were caused by infidels living on the other side of the world.


Seriously, the proponents of man-made global warming have a very large soapbox from which to render their verdicts against mankind and its culpability in this ongoing, accelerating destruction of Mother Earth. Further, they have a large megaphone through which to amplify their message - it's called The Media. Then, in 2006, less than a year after Hurricane Katrina, that noted American scientist - Al Gore, appeared on the scene with his movie. And How! No soapbox was bigger than Al Gore’s Hollywood podium. And no megaphone was bigger and louder than Hollywood’s slick production apparatus through which Gore was able to promulgate his political and worldviews. The outcome of this collaboration was the Academy Award-winning film An Inconvenient Truth – a quite convincing and well made production that made a huge splash on public awareness. It got the people on the street’s attention. It got everybody’s attention, including members of the scientific community who don’t agree with the viewpoints of Al Gore, James Hansen, and even Osama bin Laden. And that’s when some of these previously silent contrarian voices began to speak up.


Critics of the man-made global warming movement were very quick to cite errors and misstatements of fact in the movie and elsewhere. There was a lawsuit filed in the UK - Dimmock v. the Secretary of State for Education and Skills, where the plaintiff wanted to bar the film from being shown in an educational context. The plaintiff won the case – the verdict in favor of the plaintiff cited nine specific examples in the film that weren’t accepted as factual by a “scientific consensus”. These specifics came to be known as “the nine errors”. To give just a few examples:


1. The film says Hurricane Katrina was caused by man-made global warming.
       The scientific consensus says no. Global warming didn’t cause Katrina


2. According to the movie, coastal regions would be inundated by glacier-melt from Greenland and Antarctica making refugees out of a hundred million people.
       Scientific consensus holds that such glacier-melt, if it would ever happen, would take millennia and allow people living in low lying coastal areas plenty of time to relocate – plenty of time as in several hundred generations


3. The movie says there are polar bears in the arctic drowning because of the scarcity of ice due to excessive ice melt
      What really happened was four polar bears had recently been found drowned after a ferocious winter storm, not because of disappearing ice

And there are six more "errors" along the same lines cited in the verdict. As H. L. Mencken would probably have said: "Nine Convenient Un-truths.

But it doesn’t stop there. Here’s John Coleman, co-founder of the Weather Channel in an interview:


Well, when I looked at the hockey stick graph that was produced in Manning’s (Mann's) original report, and it showed a steady-line temperature through the millenniums (sic), and then it showed a sudden rise, I knew that was incorrect, I knew that couldn’t possibly be, and I started asking experts about it and I started digging into how that was produced, and I found out it was bogus science, it wasn’t real, the numbers had been massaged, the whole thing had been created. What bothered me was, the other scientists had accepted it, and why did they possibly do that? And I think the real answer to that question is, they all have an agenda, an environmental and political agenda that said “let’s pile on here, we’re all gonna make a lot of money, we’re gonna get research grants, we’re gonna get awards, we’re all gonna become famous, and I guess that’s what happened”.

The "Hockey Stick" graph came up again in an interview with Canadian climatologist Dr. Timothy Ball, who believes, as do many others, that the Earth is getting warmer, but natural causes are mostly to blame. The release of thousands of hacked emails between researchers at the Climatic Research Unit at the University of East Anglia in the UK opened up a real can of worms for the apocalyptos.
Dr. Ball on the emails: I saw the hijacking of climate science, particularly by computer modelers…and by a small group of people associated with the (UN’s) Intergovernmental Panel on Climate Change (IPCC)...
...But now, suddenly, with the exposure of these files, it’s …not only  a smoking gun but a battery of machine guns that has been exposed, and, uh, it really is deeply disturbing, because what you’ve got here is confirmation this small group of scientists, who, by the way, Professor Wegman, who was asked to arbitrate about the Hockey Stick…he identifies 42 people, and said 'look, these people are all publishing together, and they’re also peer reviewing each others’ literature…'

So Dr. Ball gleaned from the leaked emails from East Anglia a pattern of collusion by climate researchers, particularly on the “Hockey Stick” graph showing a dramatic, unnatural spike in global temperatures in recent years. Dr. Ball further described how the leaked emails show clear evidence of data culling and omission and collaborating on publishing fudged data. He cites a cabal of climate researchers who peer-review each other’s papers so they’ll be published in prestigious scientific journals such as Nature and Science, and be accepted by the world as scientific fact.

Dr. Hansen's boss at NASA, Dr. John S. Theon, now retired, wrote the following in a communiqué to the (Congressional) Minority Office at the Environment and Public Works committee dated January 15, 2009:
“I appreciate the opportunity to add my name to those who disagree that global warming is man-made,”. His major concern was the computer modeling... “My own belief concerning anthropogenic climate change is that the models do not realistically simulate the climate system because there are many very important sub-grid scale processes that the models either replicate poorly or completely omit,” He made a disturbing comment about the data, which beyond the models is at the very heart of the climate problem. “Furthermore, some scientists have manipulated the observed data to justify their model results. In doing so, they neither explain what they have modified in the observations, nor explain how they did it. They have resisted making their work transparent so that it can be replicated independently by other scientists. This is clearly contrary to how science should be done. Thus there is no rational justification for using climate model forecasts to determine public policy,”


Claude Allegre, a former French government official and member of France's Socialist Party who was at one time a proponent of man-made climate change, converted to the other side. He wrote that "the cause of climate change is unknown" and pointed out that Kilimanjaro is not losing snow due to global warming, but to local land use and precipitation changes. Allegre also pointed out that studies show that Antarctic snowfall has been stable over the last 30 years and the continent is actually gaining ice.

And then there's the late Dr. Reid Bryson of the University of Wisconsin in Madison, WI, who was considered by many to be one of the world's most astute climatologists. Dr. Bryson famously said on CNBC"...you could spit and do more damage to the environment than doubling CO2 in the atmosphere".
 
And finally, there's Canadian paleoclimatologist Dr. Tim Patterson, who says this:

• “There is no meaningful correlation between CO2 levels and Earth's temperature over this [geologic] time frame. In fact, when CO2 levels were over ten times higher than they are now, about 450 million years ago, the planet was in the depths of the absolute coldest period in the last half billion years. On the basis of this evidence, how could anyone still believe that the recent relatively small increase in CO2 levels would be the major cause of the past century's modest warming?"[31][32]

Drs. Patterson and Ball were signatories, along with 58 other climate scientists from all over the world, on an open letter to Canadian Prime Minister Stephen Harper appealing for alternative or additional points of view to be considered in a debate on the Kyoto Protocol. On a broader scale, some 900 climate scientists throughout the world signed a document opposing and disputing the "overwhelming consensus" that the earth is warming due entirely to human activities.   
On the matter of high CO2 levels in the Earth's atmosphere 450 million years ago, Dr. Patterson is correct - paleogeologic evidence suggests that the CO2 count was of the order of 4200-4500 ppmv in the late Ordovician Period, which would make it eleven times higher than it is today. The Ordovician Period ended around 438 million years ago with glaciers covering much of the planet for a million years or more and causing a mass extinction. An ice age lasting over a million years with a CO2 count eleven times higher than it is now! But, there's a fly in the soup...it's just a question of whether that fly is microscopic or if it's as big as a pterodactyl. And that fly in the soup is this - the sun shone with only about 97% of its current intensity during the Ordovician. How relevant is that? I'll publish some calculations where I plug numbers into a formula in a day or so, although whether anything meaningful will come out of these calculations is uncertain to me at this point. Stay tuned.